See how the business is really doing
The numbers live in five different systems, so nobody sees the whole picture until it is too late to act on it.

Bookings sit in one system, calls in another, invoices in a third. Each has its own report, and none of them agree.
Managers end up exporting spreadsheets to answer simple questions: how many calls did we miss, which venue is converting, what is waiting for approval.
- Connectors pull data from the systems you already use into one place.
- Dashboards show the measures that matter to each team, filtered by date, region and site.
- Reconciliation checks the numbers against the source, so the team can trust what they see.

The voice dashboard shows calls handled, bookings with and without payment, enquiries waiting for the team, payment and amendment links sent, lost bookings and transfers by region, across every venue. In the invoice pilot, dashboards show approved, pending and ageing spend by site.

The portal shows aftercare defects by priority and status, and every supplier invoice by stage, from new to posted.
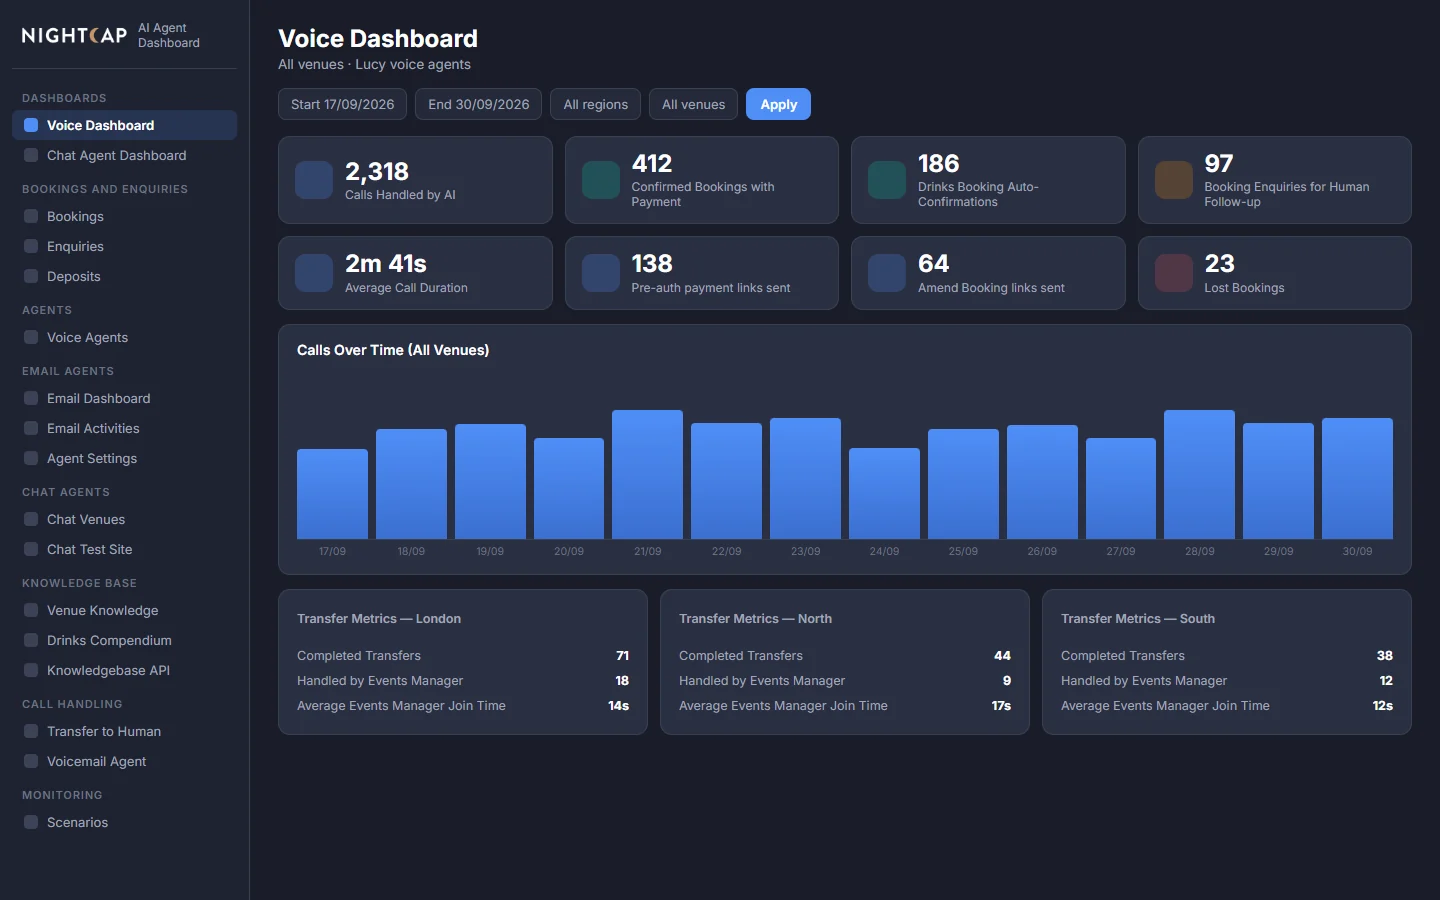
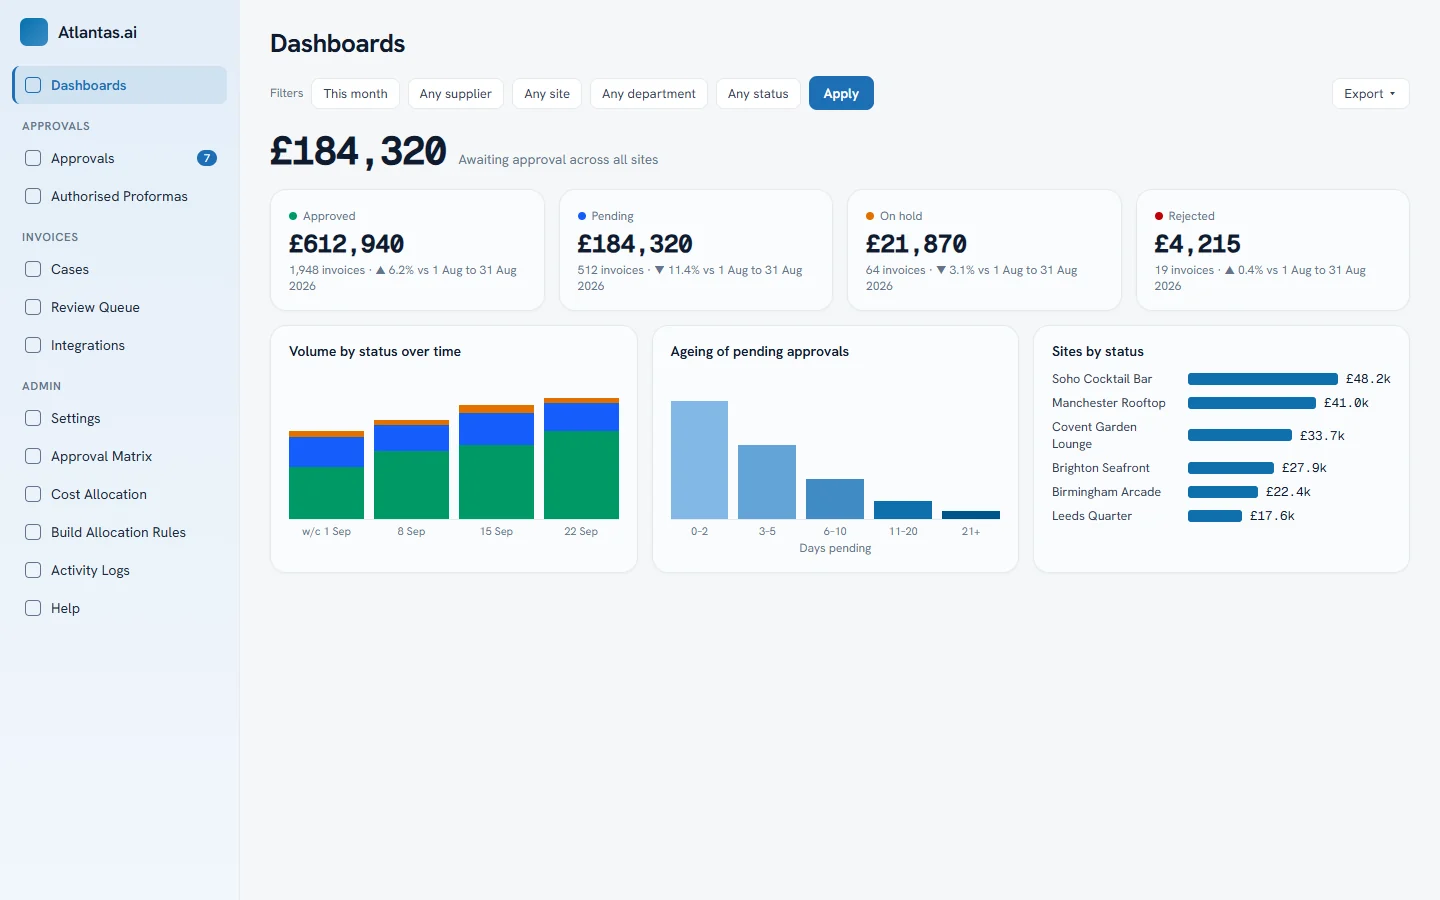
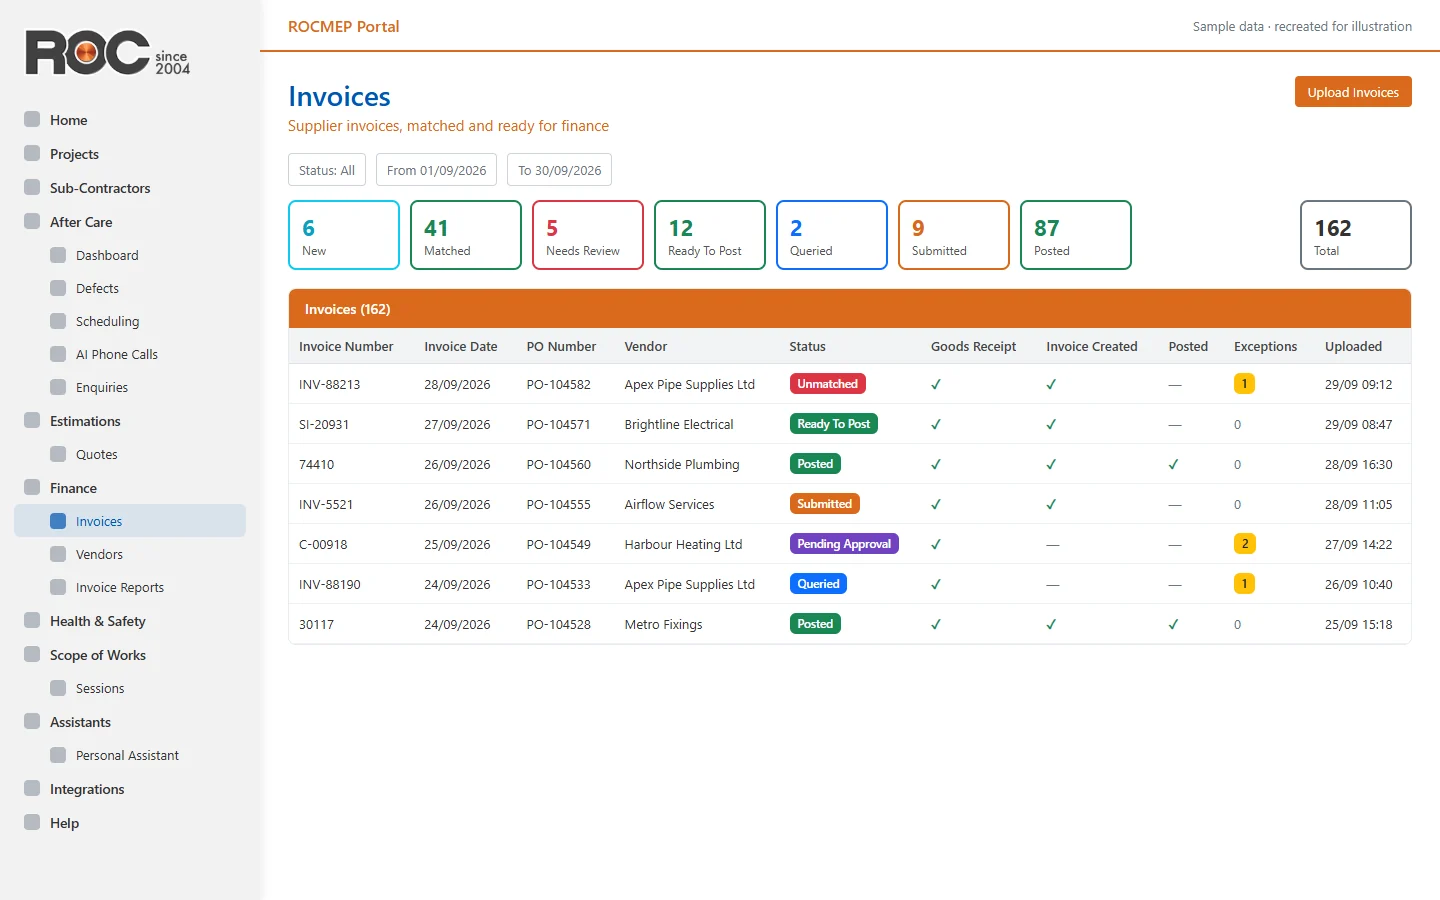
Screens recreated with sample data. No customer information is shown.